
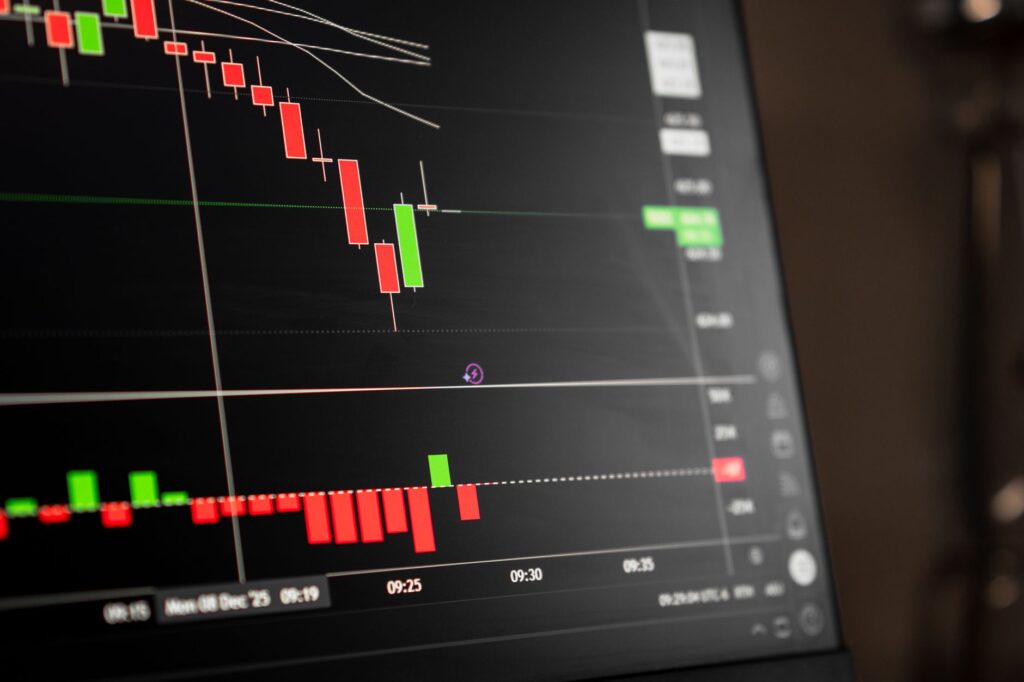
Support and resistance are the two most fundamental concepts in crypto technical analysis. Support is a price area where buying tends to be strong enough to stop a decline; resistance is where selling tends to cap a rise. Together they form a map of the price levels traders care about, helping you plan entries, stops, and targets. This guide explains how these zones form, how to identify them, the important “role reversal” flip, and how traders use them in practice. As with all technical analysis, these levels deal in probabilities, not certainties — they break regularly, and most active traders underperform a simple buy-and-hold approach.
Key takeaways
- Support is where buyers tend to step in; resistance is where sellers tend to take over.
- Treat them as zones, not exact lines — crypto frequently overshoots before reversing.
- The role-reversal flip is key: broken resistance often becomes new support, and vice versa.
- Levels confirmed by multiple touches and high volume are the most meaningful.
- Levels break often; TA is probabilistic, so always use a stop-loss and manage risk.
What support and resistance really are
At its core, support and resistance reflect human memory and behavior. When price falls to a level where buyers previously found value, they tend to buy again, creating support. When price rises to a level where sellers previously took profits, they tend to sell again, creating resistance. These zones aren’t magic — they’re collective behavior repeating around prices people remember.
Because so many traders watch the same levels, the levels can become partly self-fulfilling: people place orders there, which reinforces the reaction. But that same crowding makes levels a target for false breaks and stop-hunts. Understanding these zones is foundational to reading any chart — see our primer on how to read crypto charts.
How to identify support and resistance
There are several reliable ways to find these levels, and the strongest zones show up in more than one method at once.
Horizontal levels (swing highs and lows)
The simplest approach is marking previous swing highs (potential resistance) and swing lows (potential support) where price clearly reversed. The more times a level has been touched and respected, the more significant it is — though after many touches, a level can also weaken and break.
Round numbers
Psychologically important round numbers often act as support or resistance because traders cluster orders there. These aren’t precise levels but zones of attention.
Moving averages as dynamic levels
Some moving averages act as moving, or “dynamic,” support and resistance — price often reacts as it approaches them in a trend. Our guide to crypto moving averages explains how traders use them this way.
Volume-based zones
Areas where a lot of trading occurred tend to act as support or resistance later, because many positions changed hands there. High-volume zones are often the most durable levels.
Treat levels as zones, not lines
A critical lesson for crypto specifically: support and resistance are zones, not razor-thin lines. Crypto’s volatility means price routinely overshoots a level by several percent before reversing — wicking below support or above resistance to grab stops, then snapping back. If you place your stop-loss at the exact level everyone else uses, you’ll often get stopped out right before the move you anticipated. Build a sensible buffer into your levels and stops.
The role-reversal flip
One of the most useful behaviors in technical analysis is the flip: once a level is decisively broken, it tends to switch roles. Broken resistance frequently becomes new support, and broken support frequently becomes new resistance. The logic is behavioral — traders who watched a ceiling break now see it as a floor and buy retests of it.
This flip creates some of the highest-quality setups. When price breaks above a long-standing resistance, then pulls back to “retest” that old resistance as new support, a bounce there offers a defined entry with a clear stop just below. The flip is also central to many chart patterns, where neckline and breakout retests rely on the same principle.
How traders use support and resistance
These levels turn vague analysis into a concrete plan. Common uses include:
- Entries: buying near support in an uptrend, or selling near resistance in a downtrend.
- Stop-losses: placing a stop just beyond a level (with a buffer) so that if it breaks, you exit cheaply.
- Targets: using the next resistance above (or support below) as a logical place to take profit.
- Breakout trades: entering when price decisively breaks and confirms beyond a level, ideally on rising volume.
The real power is in defining risk. A level gives you a precise place to be wrong — if support breaks and holds below, your thesis is invalidated and you exit. That clarity is what makes support and resistance the backbone of risk management.
Bounce vs. breakout
At any level, two outcomes dominate. In a bounce, price reaches the level and reverses, respecting it. In a breakout, price pushes through and continues. The challenge is that you don’t know in advance which will happen — that’s the probabilistic nature of TA.
Volume helps you judge. A bounce on strong volume confirms the level is holding; a breakout on strong volume suggests it’s genuine. A breakout on weak volume is more likely a false break that reverses. Many traders wait for a candle to close beyond a level, rather than reacting to a single wick, to avoid getting trapped by fakeouts.
A worked example
Suppose a coin has repeatedly stalled at a particular resistance area over several weeks. Eventually a daily candle closes clearly above it on a strong volume spike. Instead of chasing immediately, a patient trader waits. Price pulls back and retests the old resistance from above — and finds support there, forming a bullish reversal candle on the retest.
That retest is the flip in action. The trader enters on confirmation, places a stop just below the flipped level (with a buffer for overshoot), and targets the next higher resistance zone. If the level fails to hold and price closes back below, the stop limits the loss. The level didn’t predict success; it provided structure and a clear invalidation point.
The honest limits
Support and resistance break constantly — that’s normal, not a flaw. No level is sacred; a strong news event, exploit, or shift in the broader market can blow through any zone. Levels are also somewhat subjective; two traders may draw them slightly differently. And the broad evidence is sobering: across markets, active traders as a group underperform a simple buy-and-hold strategy after fees and mistakes. If your goal is long-term growth, steady accumulation often beats trading levels. Practice reading them with paper trading before risking real money, and keep them inside a broader portfolio strategy.
Common mistakes
- Drawing levels too precisely. They’re zones; exact-line stops get hunted in volatile crypto.
- Ignoring volume. Volume distinguishes real bounces and breakouts from fakeouts.
- Acting on the first wick. Wait for a candle to close beyond a level to confirm a break.
- Trading against the trend. Selling resistance in a strong uptrend, or buying support in a downtrend, fights the dominant force.
- No stop-loss. Assuming a level “must” hold and skipping risk control is how accounts blow up.
FAQ
How do I know if a support level will hold?
You don’t know for certain — it’s a probability, not a guarantee. Stronger levels have been tested multiple times, formed on high volume, and align with other signals like a moving average or round number. Watch how price and volume behave at the level: a strong-volume bounce suggests it’s holding, while a weak reaction or a decisive close below warns it may break.
What’s the difference between support and resistance?
Support is a price zone below the current price where buyers tend to step in and halt declines, acting like a floor. Resistance is a zone above the current price where sellers tend to take over and cap rises, acting like a ceiling. After a decisive break, the two roles often swap — broken resistance becomes support, and broken support becomes resistance.
Should I place my stop-loss exactly at support?
No. Crypto frequently overshoots a level by a few percent to trigger stops before reversing, so a stop placed exactly at support often gets hunted. Add a buffer below the zone, sized to the asset’s volatility, so a normal wick doesn’t stop you out. The trade-off is a slightly larger loss if the level truly breaks, which is usually worth avoiding false stop-outs.
Do support and resistance work on all cryptocurrencies?
They apply to any traded asset, but they’re more reliable on liquid, large-cap coins than on thin, low-volume tokens where a single order can swing the price. On illiquid coins, levels are easily broken and faked. Stick to liquid markets while learning, treat levels as zones, and always confirm with volume before acting on a bounce or breakout.
Crypto is volatile and risky; this is education, not financial advice. Do your own research.