
Last Updated: March 2026
Crypto charts can look like hieroglyphics to beginners—green and red candles, strange lines, and confusing indicators. But reading crypto charts is a learnable skill that helps you make more informed trading and investment decisions. This beginner-friendly guide explains the essentials.
Candlestick Charts: The Basics
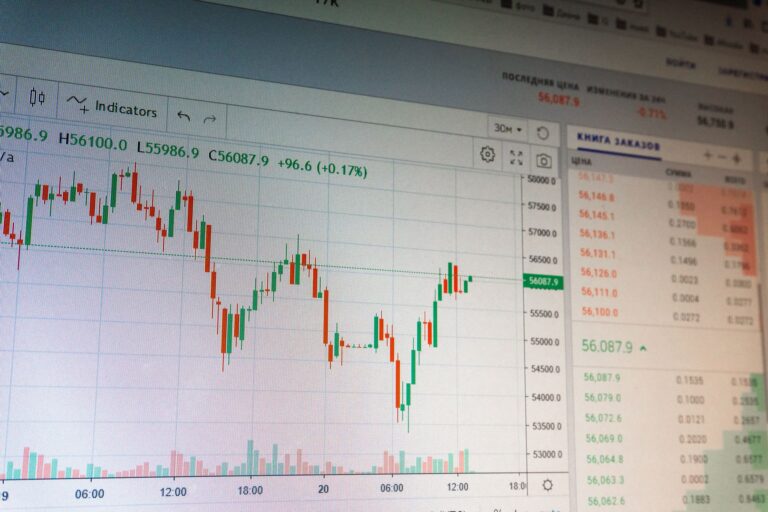
Most crypto charts use candlesticks. Each “candle” represents a time period (1 minute, 1 hour, 1 day, etc.) and shows four data points:
- Open: Price at the start of the period
- Close: Price at the end of the period
- High: Highest price during the period
- Low: Lowest price during the period
Green candles: Price went UP (close > open). Red candles: Price went DOWN (close < open). The thick body shows the open-to-close range. The thin lines (wicks) show the high and low extremes.
Support and Resistance
The two most important concepts in chart reading:
- Support: A price level where buying pressure consistently prevents further decline. Think of it as a “floor”—when price drops to support, buyers step in
- Resistance: A price level where selling pressure prevents further rise. Think of it as a “ceiling”—when price rises to resistance, sellers take profits
When price breaks through resistance, that level often becomes new support (and vice versa). These “flips” are key signals for traders.
Essential Indicators
Moving Averages (MA)
Lines showing the average price over a set period. Common settings:
- 20-day MA: Short-term trend
- 50-day MA: Medium-term trend
- 200-day MA: Long-term trend — price above the 200-day MA is generally bullish
When a shorter MA crosses above a longer MA (“golden cross”), it’s a bullish signal. The opposite (“death cross”) is bearish.
RSI (Relative Strength Index)
Ranges from 0-100. Above 70 = overbought (potential pullback). Below 30 = oversold (potential bounce). RSI helps identify when a move may be overextended.
Volume
The number of units traded. High volume confirms the strength of a price move. A breakout on high volume is more reliable than one on low volume. Declining volume during a rally can signal weakening momentum.
MACD (Moving Average Convergence Divergence)
Shows the relationship between two moving averages. When the MACD line crosses above the signal line, it’s a buy signal. Below = sell signal. The histogram shows the strength of the trend.
Chart Patterns
Bullish Patterns
- Double bottom (W shape): Price tests support twice and bounces—signals reversal upward
- Cup and handle: Rounded bottom followed by a small pullback before breakout
- Ascending triangle: Flat resistance with rising support—typically breaks upward
Bearish Patterns
- Double top (M shape): Price tests resistance twice and falls—signals reversal downward
- Head and shoulders: Three peaks with the middle highest—classic reversal pattern
- Descending triangle: Flat support with falling resistance—typically breaks downward
Timeframes
- 1-minute to 15-minute: For day traders and scalpers. See our day trading guide
- 1-hour to 4-hour: For swing traders holding days to weeks
- Daily and weekly: For investors making longer-term decisions. Most useful for most people
Higher timeframes are more reliable—a pattern on the daily chart is more significant than on the 5-minute chart.
Common Beginner Mistakes
- Over-analyzing: Don’t use 10 indicators at once. Start with price action, support/resistance, and volume
- Ignoring the trend: “The trend is your friend.” Don’t fight the prevailing direction
- Confirmation bias: Don’t see only what supports your existing position
- Chart-only decisions: Charts show price history, not fundamentals. Use charts alongside research. See our research tools guide
Where to View Crypto Charts
- TradingView: The most popular charting platform with extensive tools and community ideas
- DexScreener: Real-time DEX charts for all tokens. Essential for new tokens
- Exchange charts: Binance, Coinbase, and other exchanges have built-in charting. See our exchange guide
Frequently Asked Questions
Do crypto charts actually work?
Charts reflect market psychology and can identify high-probability setups. They’re not crystal balls—no indicator guarantees future price. Use them as one tool alongside fundamental analysis and risk management.
What’s the most important indicator for beginners?
Support/resistance levels and volume. These are the foundation of all technical analysis and don’t require any indicator overlays. Master these before adding complexity.
Should I use technical analysis for long-term investing?
For long-term investors, fundamentals matter more than charts. However, the 200-day moving average and weekly RSI can help identify better entry points for DCA adjustments. See our portfolio strategy.
Related Articles
- What Is Blockchain? A Simple Guide for Beginners
- Best Crypto for Beginners: How to Start in 2026
- How to Buy Bitcoin: Complete Beginner’s Guide for 2026
- Crypto Glossary: 100+ Essential Terms Explained
- Best Crypto Apps 2026: Top Mobile Platforms
- What Is Cryptocurrency? Complete Beginner’s Guide
- What Is Market Cap in Crypto? Why It Matters
- How to Convert Crypto to Cash: Complete Guide